Glossary of COT & Futures Terms: Plain-English Definitions
Feb 14, 2026
Glossary of COT & Futures Terms
A reference glossary for terms used in COT report analysis. Definitions are written for clarity, not exhaustiveness. Where relevant, notes explain how each term applies specifically to our analysis.
C
CFTC (Commodity Futures Trading Commission)
The U.S. federal agency that regulates commodity futures and options markets. The CFTC publishes the Commitment of Traders report weekly. Website: cftc.gov
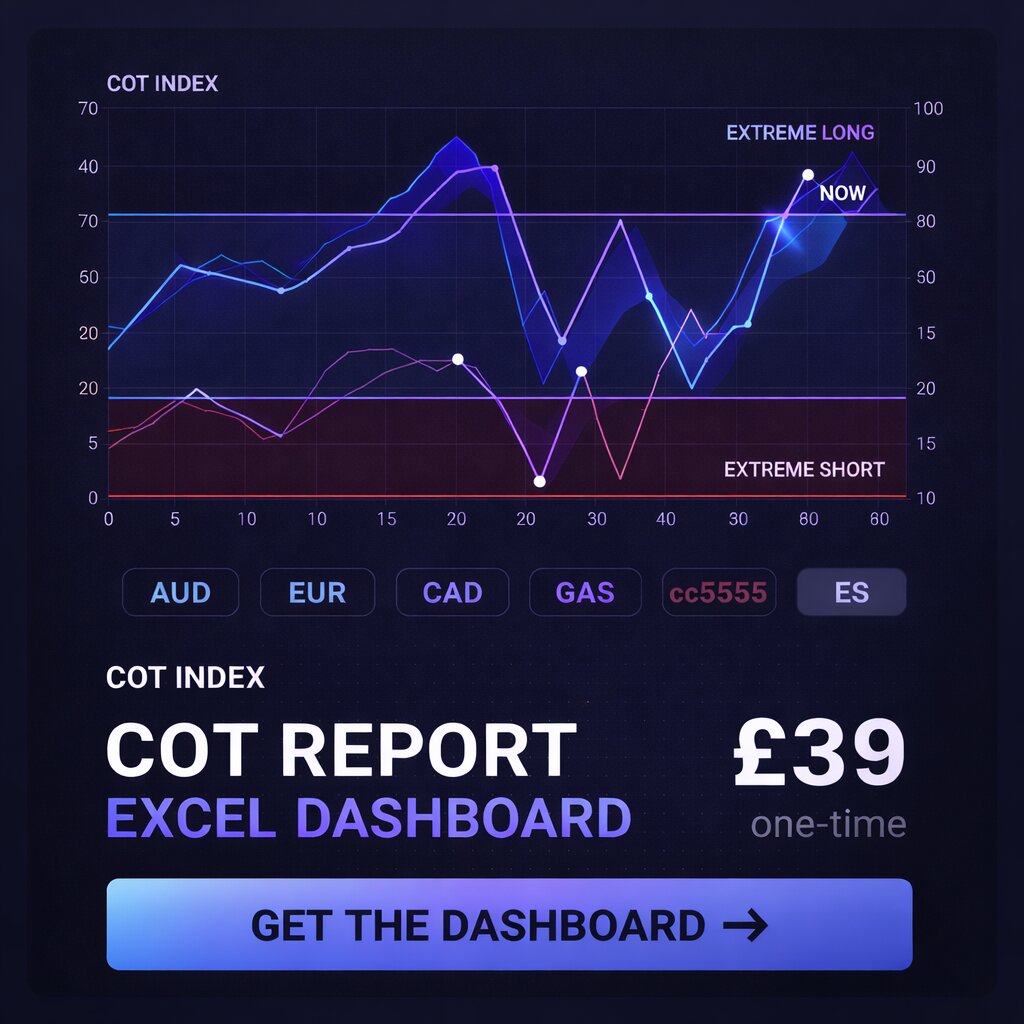
COT Report (Commitment of Traders Report)
A weekly report published by the CFTC showing how different categories of market participants are positioned in futures markets. Published every Friday at 3:30 PM ET, reflecting data from the preceding Tuesday. The most widely used version for macro analysis is the Legacy Futures-Only report.
Commercial Traders (Hedgers)
Entities that use futures to hedge a business exposure. A wheat farmer selling futures to lock in a price, an airline buying crude oil futures to hedge jet fuel costs, a bank using currency futures to manage foreign exchange risk — all are commercial traders. They are required to demonstrate that their futures positions relate to underlying business activity.
In COT data, commercials often hold the opposite position to large speculators. When speculators are heavily net long, commercials are typically net short, and vice versa. This is a structural feature, not a signal in itself.
Contrarian Indicator
A way of interpreting COT data where extreme speculator positioning is read as a potential signal for a price reversal. The reasoning: if nearly everyone who can go long already has, there are fewer remaining buyers to push prices higher. This is a common use of COT data in trading analysis, though it is not a reliable timing tool on its own.
D
Dealer / Intermediaries
A trader category in the Disaggregated COT report. Refers to financial intermediaries such as swap dealers and large banks. Not used in the Legacy report format.
Disaggregated COT Report
A newer version of the COT report that breaks down the "Commercial" category into sub-groups: Producer/Merchant/Processor/User, Swap Dealers, Managed Money, and Other Reportables. Provides more granularity than the Legacy report but has a shorter historical record. We use the Legacy format on this site.
F
Futures Contract
A standardised agreement to buy or sell a specific quantity of an asset at a predetermined price on a future date. Futures are traded on exchanges (e.g., CME, CBOT, ICE). COT data covers futures (and optionally options) positions.
H
Hedger
See: Commercial Traders.
L
Large Speculators
See: Non-Commercial Traders.
Legacy COT Report
The original, longest-running version of the COT report. Divides traders into three categories: Commercial, Non-Commercial, and Non-Reportable. The Legacy format has continuous data going back to the 1980s for most markets. This is the format used by this site.
Long Position
A futures position that profits if the price of the underlying asset rises. A trader holding 1,000 long gold futures contracts expects gold prices to increase.
Long-Short Ratio
The ratio of long contracts to short contracts for a given trader category. Not used in our analysis directly — we focus on net positions.
M
Managed Money
A trader category in the Disaggregated COT report. Refers primarily to hedge funds and Commodity Trading Advisors (CTAs). Broadly equivalent to the "Non-Commercial" category in the Legacy report, though the classification is slightly different.
Market Sentiment
A general term for the overall positioning or directional bias of market participants. COT data is one tool used to assess market sentiment. Other sentiment tools include options skew, surveys, and volatility measures.
N
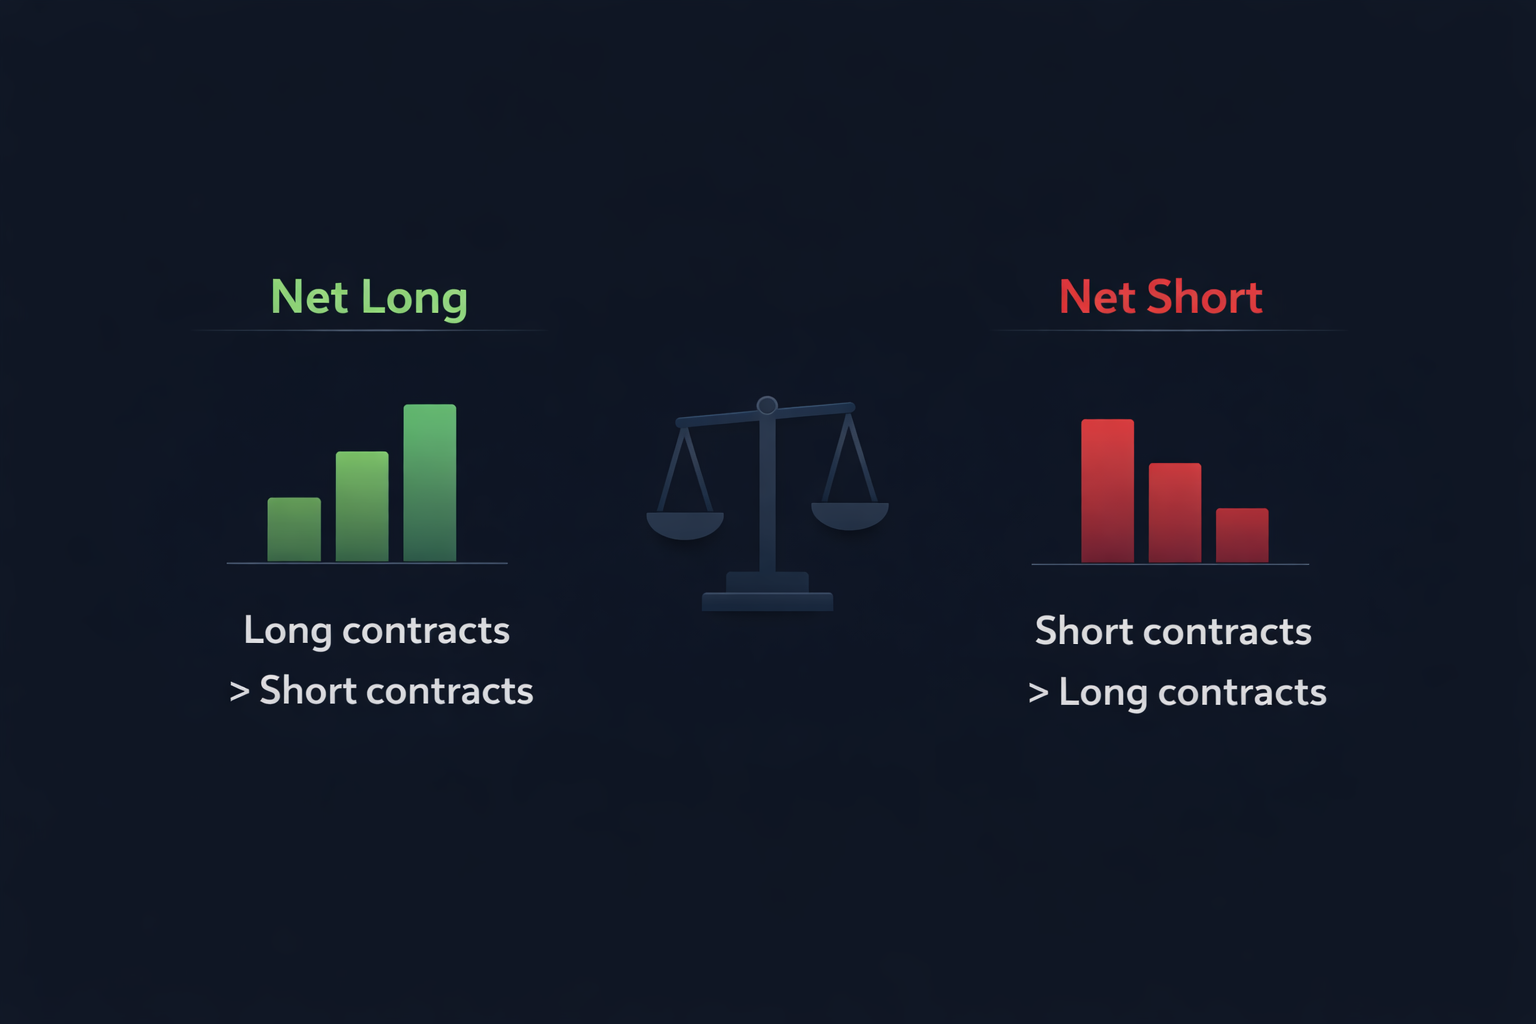
Net Long
When a trader category holds more long contracts than short contracts. Example: a non-commercial net long position of +150,000 means the group holds 150,000 more long contracts than short contracts. A positive net position.
Net Position
Long contracts minus short contracts for a given trader category. The primary metric used in our analysis.
- Positive net position = net long
- Negative net position = net short
- Zero = balanced (long contracts equal short contracts)
Net Short
When a trader category holds more short contracts than long contracts. Expressed as a negative number. Example: -80,000 means 80,000 more short contracts than long contracts.
Non-Commercial Traders (Large Speculators)
Traders who do not have a commercial hedging reason for their futures positions — they trade futures to make a profit. In practice, this category is dominated by hedge funds, commodity trading advisors (CTAs), and large asset managers. This is the primary category analysed on this site.
Non-commercial positioning is reported as separate long, short, and spreading figures. Net position is calculated as: long minus short (excluding spreading).
Non-Reportable Positions (Small Traders)
The residual category in the Legacy COT report — traders whose positions are below the CFTC's mandatory reporting thresholds. Typically small retail traders. Non-reportable positions are calculated as: total open interest minus reportable positions. We note this category but do not centre analysis on it.
O
Open Interest
The total number of outstanding futures contracts that have not been settled or closed. Each open contract represents one buyer and one seller. Open interest is a measure of market activity and liquidity. Rising open interest during a price move suggests new money entering the market; falling open interest suggests positions being closed.
On our dashboard, the "Index" column shows open interest for each market.
P
Percentile Rank
A measure of where the current net position falls relative to historical observations. If gold's non-commercial net long position is at the 95th percentile, it means the current reading is higher than 95% of all weekly observations in the historical window.
On this site, percentiles are calculated empirically over a rolling 104-week (2-year) window. A 99th-percentile reading means the position is near the top of the two-year range; a 1st-percentile reading means near the bottom.
Percentile extremes (above 95th or below 5th) are highlighted in our weekly analysis as noteworthy, not as trade signals.
R
Reportable Positions
Positions above the CFTC's minimum reporting thresholds. Traders holding above these levels must report their positions to the CFTC. Thresholds vary by market. The sum of commercial and non-commercial reportable positions, plus non-reportable, equals total open interest.
S
Short Position
A futures position that profits if the price of the underlying asset falls. A trader holding 500 short crude oil contracts expects oil prices to decrease.
Spreading
Holding simultaneous long and short positions in different contract months of the same futures market (calendar spread) or in related but different markets. Spreading positions are reported separately in the COT report and are excluded when calculating net long/short figures.
Swap Dealer
A trader category in the Disaggregated COT report. Typically large financial institutions that deal in over-the-counter swaps and use futures to hedge those exposures. Not a category in the Legacy report format.
T
TFF Report (Traders in Financial Instruments)
A COT report variant focused exclusively on financial futures: interest rates, currencies, stock indices, and certain other instruments. Breaks down traders into Dealer/Intermediary, Asset Manager/Institutional, Leveraged Funds, and Other Reportables. More relevant for FX and bond analysis than the Legacy report.
Total Open Interest
The sum of all outstanding futures contracts in a given market. Equals the sum of reportable commercial positions, reportable non-commercial positions, and non-reportable positions (for both long and short sides, divided by two, since each contract has one buyer and one seller).
Z
Z-Score
A statistical measure of how far the current value is from the historical mean, expressed in standard deviations.
Formula: (Current Value − Historical Mean) / Standard Deviation
Interpretation:
- Z-score of 0: At the historical mean
- Z-score of +1.0: One standard deviation above mean (roughly 84th percentile in a normal distribution)
- Z-score of +2.0: Two standard deviations above mean (roughly 97th percentile) — statistically unusual
- Z-score of −2.0: Two standard deviations below mean — statistically unusual in the other direction
We calculate Z-scores over a 104-week rolling window. A Z-score above ±2.0 is flagged as a statistically notable positioning extreme.
Z-scores and percentile ranks are complementary. Percentile rank shows where the current reading sits in the empirical distribution; Z-score shows how many standard deviations from the mean it sits, assuming a roughly normal distribution.