How to Read the COT Report — I Built a Live Excel Dashboard Pulling 11 Years of CFTC Data
Feb 19, 2026
The CFTC publishes Commitment of Traders data every Friday. It's free, it's public, and it covers 41 markets across FX, metals, energy, indices, bonds, and crypto.
Most traders either ignore it or look it up manually once in a while on a third-party site.
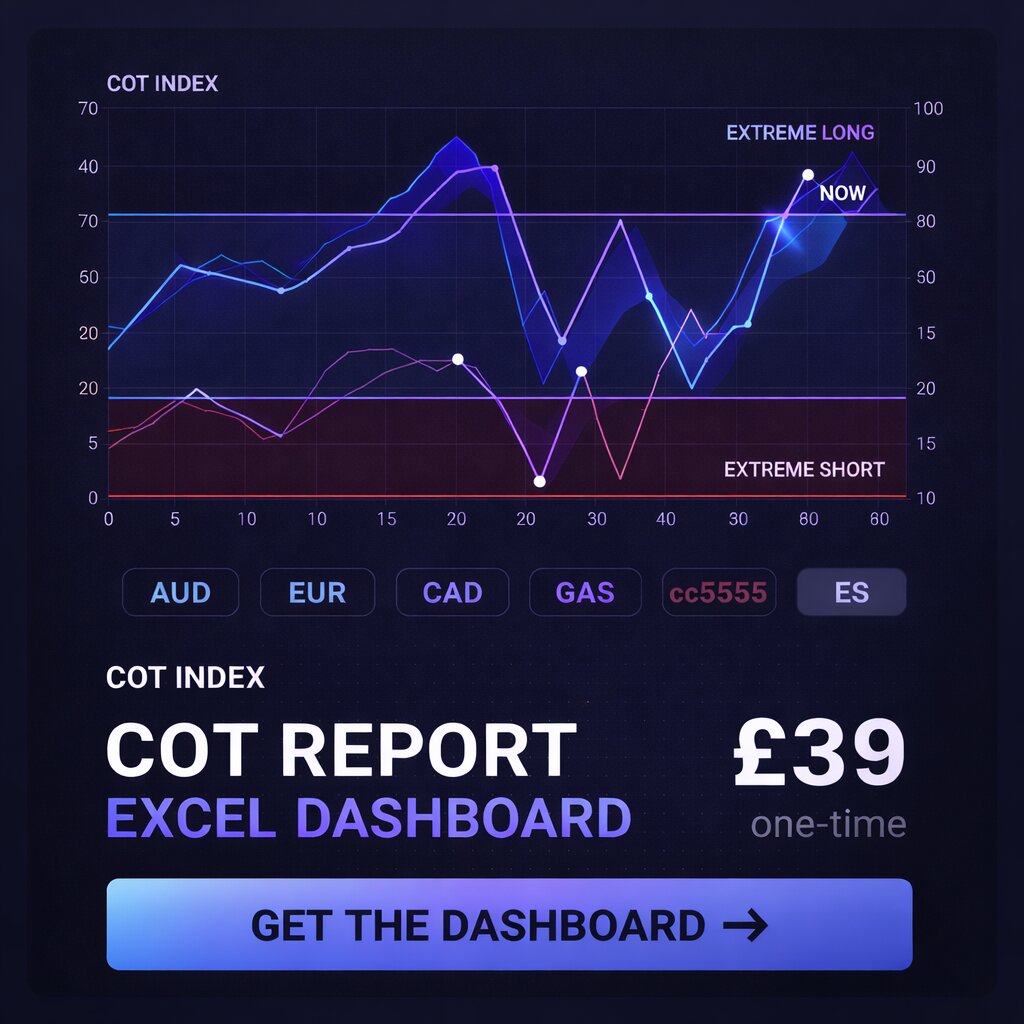
I wanted something different: a single COT report chart that auto-refreshes every week, shows me net positioning for every market at a glance, calculates a 52-week percentile index, and flags extreme positioning automatically — without me touching it.
Here is exactly how I built it, and where it gets genuinely complicated.
What the COT Report Is — and Why Traders Use It
Before getting into the build, it is worth understanding what CFTC COT data actually measures and how to read a COT report in practice.
The Commitment of Traders report breaks market participants into three groups:
Non-Commercials (large speculators — hedge funds, managed money). These are the trend followers. They tend to pile in late and get caught at extremes.
Commercials (hedgers — producers, exporters, corporates). These are the people who actually need the underlying asset. Airlines hedge jet fuel. Farmers hedge corn. They tend to be on the right side of the market over time.
Non-Reportables (small speculators). Less useful for analysis.
The most common use of COT report analysis is watching when Non-Commercial positioning reaches a historical extreme — because crowded trades tend to reverse. If every speculator is net long AUD and the COT Index hits 100, there are no more buyers left. That is the setup.
This is not a crystal ball. Understanding how to use the COT report means treating it as a sentiment indicator, best used alongside price action, not instead of it.
What the Finished Dashboard Looks Like
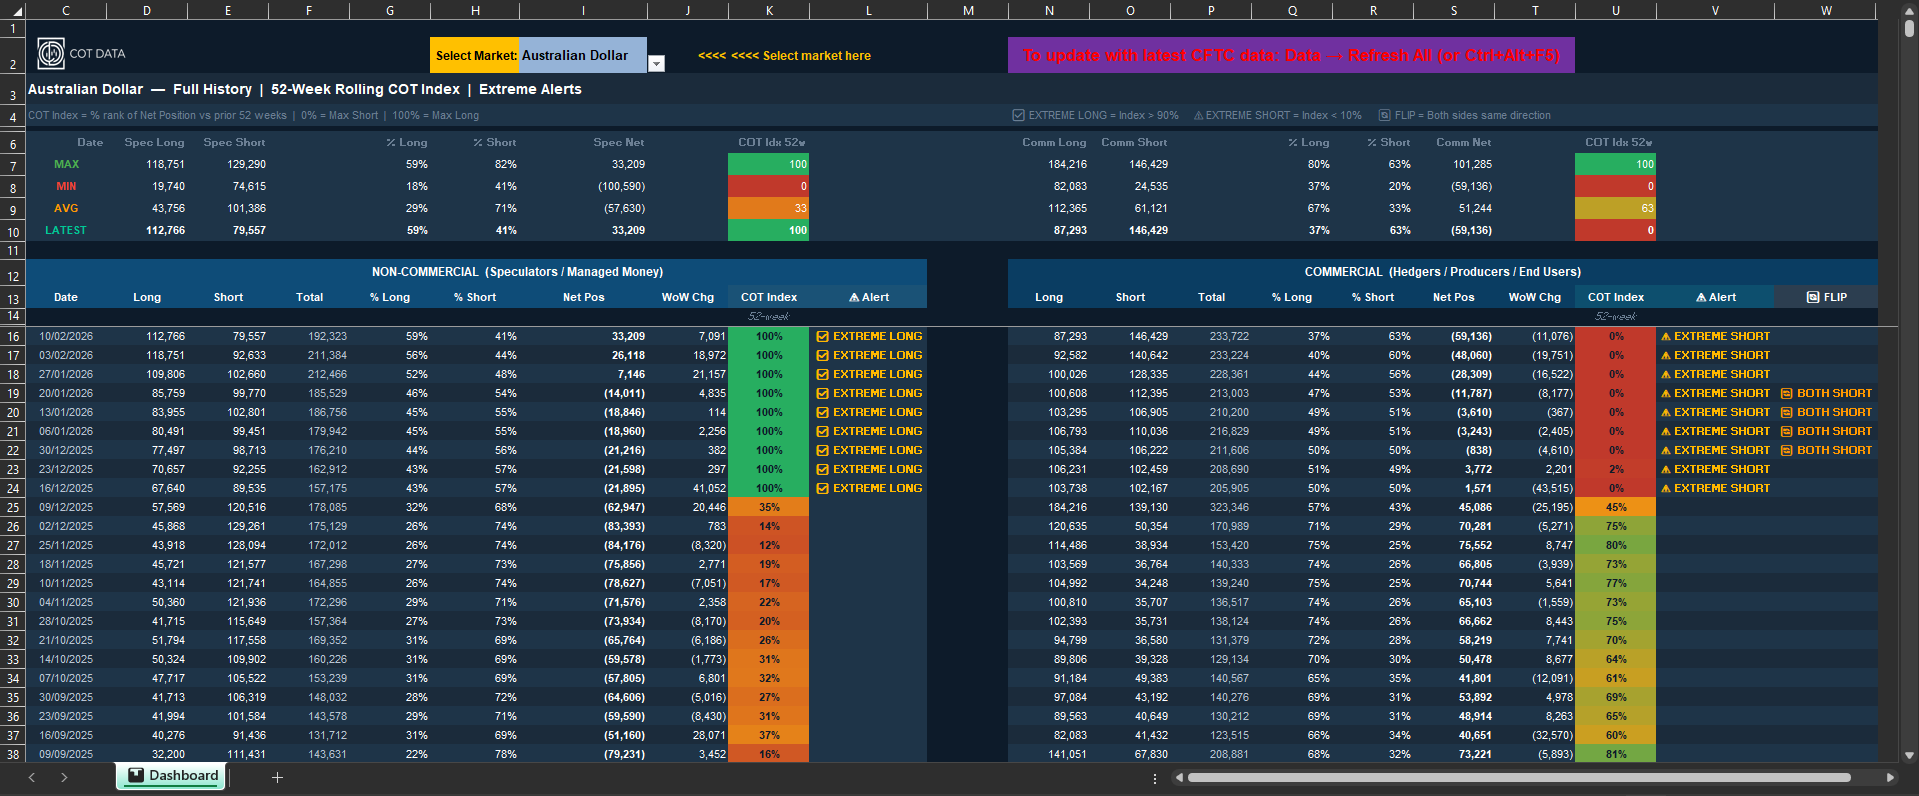
The finished COT report chart: Australian Dollar full history, 52-week rolling COT Index, and extreme alert flags for both speculators and commercials.
The file has two main sections:
Left panel — Speculators (Non-Commercial): Long contracts, Short contracts, % Long, % Short, Net Position, Week-on-Week Change, COT Index (52-week percentile), and an Extreme Alert flag.
Right panel — Commercials: Same columns. The Commercial COT Index often runs inverse to the Speculator index, which serves as a useful confirmation.
A dropdown at the top lets you select any of the 41 markets. The entire commitment of traders chart updates in one click — no manual data entry, no copy-pasting from the CFTC website.
Max, Min, Average, and Latest rows at the top give you immediate context. Green means extreme long territory. Red means extreme short. The cells are conditionally formatted based on the actual 52-week range, not arbitrary thresholds.

The Architecture: Three Layers
Layer 1 — The CFTC API (The Easy Part)
The CFTC exposes a public Socrata API at:
https://publicreporting.cftc.gov/resource/6dca-aqww.json
You can query it directly from Power Query with a Web connector. The basic call to get a specific market's CFTC COT data looks like:
https://publicreporting.cftc.gov/resource/6dca-aqww.json
  ?cftc_contract_market_code=232741
  &$limit=5000
  &$order=report_date_as_yyyy_mm_dd DESC
Each market has a unique CFTC contract code. Australian Dollar is 232741. Euro FX is 099741. Getting all 41 codes right — and verifying they map to the correct market — took longer than expected. Some codes have a + suffix. Some markets share similar names. The debug step here is non-trivial.
Layer 2 — Power Query Transformations (Where It Gets Messy)
Once the raw JSON lands in Power Query, you need to:
- Parse the nested JSON structure
- Cast columns to correct data types (dates as dates, positions as integers)
- Filter to only the columns you need (there are 170+ columns in the raw feed)
- Handle nulls — early CFTC COT historical data records have missing fields that will break calculations if not accounted for
- Deduplicate (the API occasionally returns duplicate rows for the same report date)
- Sort descending by date so your most recent 52 rows are always rows 1–52
The column names in the raw API are not intuitive. Non-commercial long positions are noncomm_positions_long_all. Commercial short positions are comm_positions_short_all. You will be mapping these to readable names across 41 queries.
To avoid 41 separate connections, I structured it as one parameterised query that accepts a market code and returns a clean table. A second query passes in the selected market code from the dropdown cell. This keeps the workbook from becoming a maintenance nightmare.
Layer 3 — The COT Index Formula (The Interesting Part)
The COT Index is how you read COT report positioning in historical context. It is a percentile rank of the current Net Position against the prior 52 weeks:
COT Index = (Current Net − 52W Min) / (52W Max − 52W Min) × 100
- 0 = current net position is at its 52-week low
- 100 = current net position is at its 52-week high
- Above 90 triggers an EXTREME LONG alert
- Below 10 triggers an EXTREME SHORT alert
In Excel, calculating this across a rolling 52-week window — dynamically, as new data comes in each week — requires either a helper column approach or an array formula. I used a dynamic array formula referencing the Power Query output table, which means it recalculates automatically on refresh.
The edge case that catches people: the first year of data has fewer than 52 weeks available. You need a formula that gracefully handles a shorter window without returning errors. Getting that conditional logic right across 41 markets, with named ranges that update dynamically, is where most of the build time went.
COT Report Trading Strategy — How to Actually Use the Data
Knowing how to read the COT report is one thing. Knowing when the signal matters is another. A few principles worth understanding:
Extremes are more meaningful than direction alone. A COT Index of 85 does not tell you much. A COT Index of 98 — sustained for three consecutive weeks — starts to mean something. The further from the mean, the fewer times in recent history the market has been this crowded.
COT report forex analysis tends to be cleaner than commodities. FX majors (EUR/USD, AUD/USD, GBP/USD) have large, liquid speculative positioning with well-documented historical cycles. Commodity markets like natural gas or cocoa can sit at extremes for months during supply shocks.
Commercial and Speculator divergence is the core signal. When Commercials are at an extreme net long and Speculators are at an extreme net short in the same market, that is the alignment traders watch for. The dashboard flags this as a FLIP indicator.
COT data lags. The weekly COT report covers positioning as of Tuesday close, published Friday. By the time you are reading it, the market has moved three more days. It is a positioning map, not a real-time ticker.
The Refresh Process
When the CFTC publishes Friday's report (usually by 3:30 PM EST), you open the file and hit Data → Refresh All. Power Query fires 41 API calls, pulls the latest weekly COT report data, and the entire dashboard updates in about 90 seconds.
No CSV downloads. No copy-pasting. No manual formula updates.
That is the part that took the most engineering to get right — and what makes this different from every static COT spreadsheet I have seen sold online.
What I Did Not Cover Here
A complete COT report explained in full would need to walk through:
- Setting up the parameterised Power Query in detail
- The full market code reference table for all 41 instruments
- Handling the API's rate limiting and occasional downtime
- The conditional formatting rules and how they are tied to the dynamic ranges
- Debugging when a market code returns empty data (it happens)
- The FLIP indicator logic (when both Commercials and Speculators move in the same direction — a rarer but significant signal)
- Per-market nuances: how to read a gold COT report differs slightly from how to read a COT report for natural gas or EUR/USD, because their speculator bases behave differently
That is realistically 15–20 hours of building and debugging for someone starting from scratch, assuming you are comfortable with Power Query. If you are newer to it, add another 10 hours.
If You Want the Finished File
I have already put those hours in.
The completed file covers all 41 markets, auto-refreshes from the CFTC API, and includes the COT Index, Extreme Alerts, and the FLIP indicator — ready to use from day one.
Further Reading
- Live COT Dashboard — web version covering the same 41 markets, updated weekly
- Full Methodology — how percentiles, averages, and the COT Index are calculated
- Weekly COT Report Analysis — every Friday, automated analysis flagging extremes across all markets
Data sourced directly from the CFTC public API. Educational content only. Not financial advice. Past COT positioning does not guarantee future price movements.