COT Mar 17 – 2Y Treasury Shorts & AUD Extremes
Mar 17, 2026
This week's CFTC positioning data shows hedge funds holding their largest net long Australian Dollar position in two years while 2Y Treasury shorts reached the lowest level on record in both the 2-year and 10-year samples.
Previous week's analysis highlighted positioning extremes across precious metals and energy. This week, the most pronounced extremes shifted to FX and fixed income, with nine markets registering 95th+ or 5th- percentile readings within the 2-year window.
Methodology & Data Source
- Source: CFTC Commitment of Traders Report (Legacy Format)
- Analysis: Non-Commercial traders (large speculators—hedge funds, asset managers)
- Percentiles: Dual window—2-year (104 weeks) primary + 10-year (520 weeks) structural context | Full Methodology →
- 📥 Download this week's data (JSON)
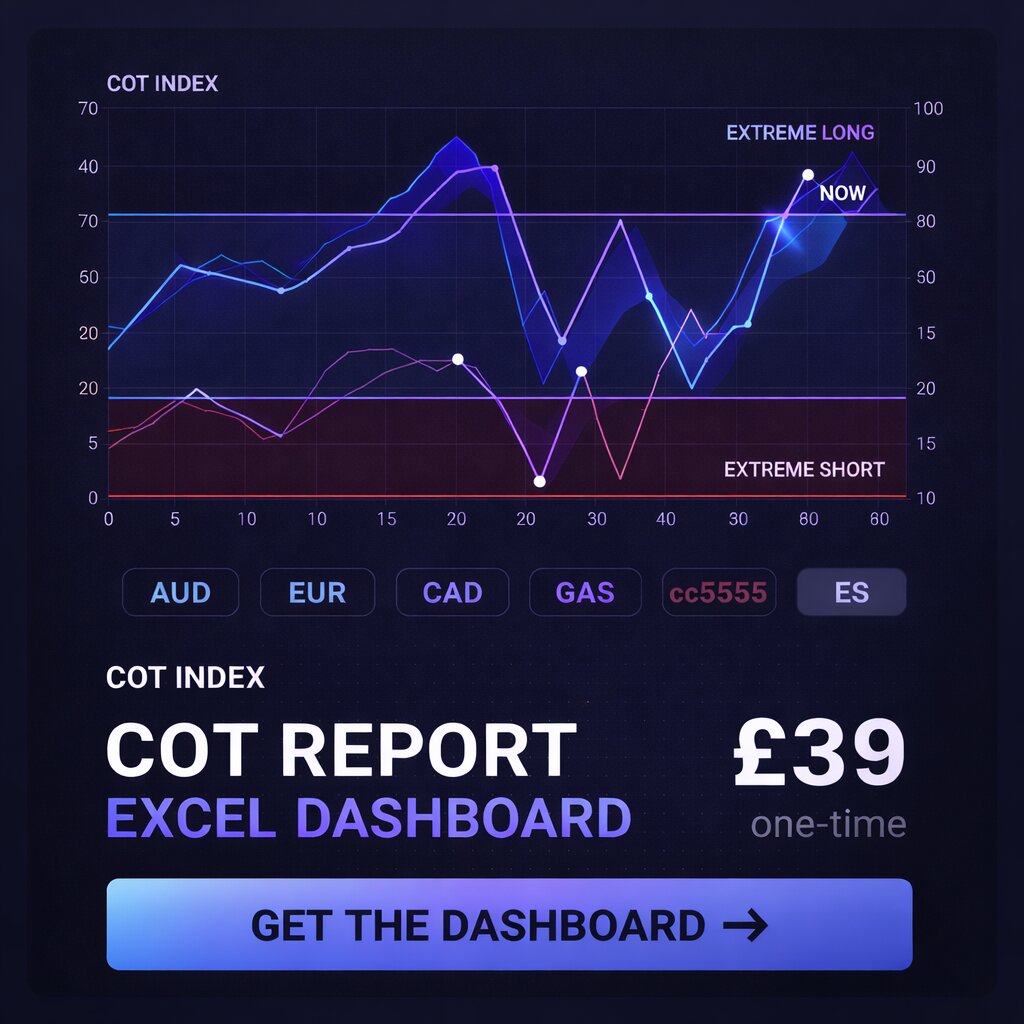
- 📊 View Interactive Dashboard →
What Stood Out This Week
Australian Dollar net long positioning hit 99th percentile in both the 2-year and 10-year windows (Z-score: +2.57), representing the most extreme crowded net long condition across all FX markets tracked. The build has been sustained: positioning sits +169,451 contracts above the 4-week average and +144,954 above the 13-week average, indicating persistent accumulation rather than a tactical spike. Non-commercial net longs represent 26% of total open interest—a heavily concentrated positioning footprint for a major currency pair.
📊 Top 10 Extreme Positions
The following table shows the 10 most extreme positions relative to their 104-week history:
| Rank | Market | Net Position | 2Y Percentile | 10Y Percentile | Z-Score |
|---|---|---|---|---|---|
| 1 | 2Y Treasury | -1,482,667 | 1st | 1st | -2.02 |
| 2 | Australian Dollar | +69,061 | 99th | 99th | +2.57 |
| 3 | Bitcoin | +1,773 | 99th | 99th | +2.11 |
| 4 | Gold | +159,869 | 1st | 29th | -1.79 |
| 5 | Silver | +21,881 | 1st | 25th | -2.30 |
| 6 | Soybean Oil | +120,097 | 99th | 93rd | +2.25 |
| 7 | Wheat (HRW) | +7,579 | 99th | 56th | +1.79 |
| 8 | Soybean Meal | +102,538 | 98th | 81st | +1.93 |
| 9 | Cocoa | -17,859 | 3rd | 7th | -2.18 |
| 10 | Canadian Dollar | +886 | 94th | 65th | +1.98 |
Extreme Positions Deep Dive
2Y Treasury registered the most extreme net short positioning in the dataset: 1st percentile across both 2-year and 10-year windows. This reflects a sustained build, with net shorts currently -547,401 contracts below the 4-week average and -472,423 below the 13-week average. Non-commercial net shorts represent -31.3% of open interest—an unusually large concentration of directional short exposure in a Treasury contract.
Commercials hold the offsetting net long position (+1,382,374 contracts, 29.2% of OI), framing this as a classic hedger vs. speculator standoff. The extreme positioning level has no precedent within this sample: Z-score sits at -2.02, meaning net shorts are more than two standard deviations below the historical mean.
Australian Dollar reached 99th percentile net long positioning (2-year and 10-year), driven by persistent accumulation across recent weeks. The 26% crowding ratio (net longs as a percentage of open interest) signals concentrated hedge-fund conviction rather than broad participation. Commercials hold -93,772 net shorts (-35.3% of OI), reflecting hedging intensity on the opposite side.
The build pattern suggests structural positioning rather than event-driven entry: 4-week and 13-week deviations are both large and directionally aligned (+169,451 and +144,954 respectively). Within this 104-week sample, readings beyond Z-score +3.0 have been rare, meaning this positioning level is approaching the upper boundary observed in recent history.
Gold & Silver (Metals Complex) both sit at 1st percentile net long positioning within the 2-year window, though the 10-year context is less extreme (Gold 29th percentile, Silver 25th). This reflects a washout of speculative net long exposure relative to the recent 2-year range, but the positioning level has precedent in earlier cycles.
Gold net longs stand at 159,869 contracts, with a crowding ratio of 38.9% of OI—still substantial absolute exposure, but low relative to the 2-year distribution. Silver net longs are 21,881 (19.1% of OI). Both markets show sustained low positioning: Gold sits -72,134 below full-period average, Silver -25,929 below. The shared 1st percentile reading across two related markets amplifies the theme: precious metals speculative exposure has been structurally reduced over recent months.
Bitcoin reached 99th percentile net long positioning in both windows (Z-score: +2.11), representing the most crowded crypto net long condition in the dataset. The 7.4% crowding ratio is lower than FX or metals extremes, but notable for a newer, more volatile contract. Commercials hold -1,862 net shorts. The build has been sustained: positioning sits +2,196 above the full-period average, consistent with persistent accumulation rather than a single-week spike.
Cocoa sits at 3rd percentile net short positioning (2-year) and 7th percentile (10-year), marking an extreme speculative net short crowding condition. Net shorts stand at -17,859 contracts (Z-score: -2.18). This is the inverse of the agricultural crowding pattern seen in soybean complex: speculators are heavily net short cocoa while piling into net longs in meal and oil.
"So What?" — Positioning Scenarios
Australian Dollar (FX — 99th percentile, Z-score: +2.57)
- If AUD price continues higher while positioning remains at 99th percentile, then this is consistent with a crowded consensus trade that is still "working"—historically, similar configurations have sometimes persisted for several weeks before unwinding, particularly when the trend is supported by macro tailwinds.
- If price stalls or reverses while the 26% crowding ratio persists, then this may indicate elevated unwind risk—concentrated net long exposure can prove vulnerable to rapid repositioning when price momentum fades, though timing cannot be determined from positioning data alone.
- If net longs retrace sharply toward median over 2-3 weeks without a corresponding price breakdown, then the repositioning may reflect tactical profit-taking or month-end rebalancing rather than a structural shift in directional conviction.
Gold & Silver (Metals Complex — both 1st percentile)
- If precious metals prices stabilise or move higher while positioning stays at these low percentiles, then this may be consistent with a washed-out speculative base—historically, similar low-crowding conditions have sometimes coincided with selling exhaustion phases, though low positioning can persist for extended periods.
- If positioning weakens further (falls below current Z-scores of -1.79 and -2.30), then net longs would be entering territory with limited precedent in this 104-week sample, amplifying the crowding washout narrative—though the 10-year context (29th and 25th percentiles) suggests this level has occurred in earlier cycles.
- If Gold and Silver positioning diverge in coming weeks (one rising, one falling), then the paired extreme may be breaking down, indicating differentiated macro drivers rather than a unified precious metals theme.
2Y Treasury (Bonds — 1st percentile, Z-score: -2.02)
- If 2Y yields continue rising while net shorts remain at 1st percentile, then the extreme short crowding is "working" in directional terms—but the -31.3% crowding ratio suggests this is a heavily concentrated trade that may be sensitive to any dovish rate surprises or liquidity events.
- If yields stabilise or fall while positioning stays at this extreme net short level, then this may indicate unwind risk—speculative shorts at Z-score -2.02 would face mark-to-market pressure, and historically similar concentrated short positions have sometimes preceded rapid covering rallies.
- If positioning retraces toward median over several weeks without a corresponding yield move, then the repositioning may reflect portfolio rebalancing or hedging adjustments rather than a shift in rate views—though the sustained build (4-week and 13-week deviations both large) suggests this is structural conviction, not a tactical entry.
Top Weekly Changes
The largest absolute positioning shift this week occurred in 2Y Treasury, where net shorts deepened by -547,401 contracts relative to the 4-week average. This was not a single-week spike: the 13-week deviation (-472,423) is similarly large, indicating persistent speculative selling pressure over the past quarter. 5Y Treasury showed a parallel pattern: net shorts now sit -556,589 below the 4-week average, though the percentile rank (63rd) remains mid-range rather than extreme.
Category Breakdown
FX: Australian Dollar reached 99th percentile (both 2-year and 10-year), representing the most extreme net long crowding across all currency pairs. The 26% crowding ratio and sustained build (+169,451 vs 4-week average, +144,954 vs 13-week) frame this as a structural conviction trade. Canadian Dollar registered 94th percentile net long positioning (65th percentile 10-year), with a Z-score of +1.98. Japanese Yen sits at 19th percentile net short, below median but not extreme. Remaining 8 market(s) near median: US Dollar Index (69th pct), Euro FX (32nd pct), British Pound (7th pct), Swiss Franc (76th pct), Brazilian Real (81st pct), New Zealand Dollar (48th pct), Mexican Peso (59th pct).
Metals: Gold and Silver both registered 1st percentile net long positioning within the 2-year window, though 10-year context is less extreme (29th and 25th percentiles respectively). Gold net longs stand at 159,869 contracts (38.9% of OI), with a Z-score of -1.79. Silver net longs are 21,881 (19.1% of OI, Z-score -2.30). The paired extreme reflects a washout of speculative long exposure relative to the recent 2-year range. Remaining 2 market(s) near median: Copper (71st pct), Platinum (49th pct).
Energy: Natural Gas sits at 6th percentile net short positioning (7th percentile 10-year), with net shorts at -178,029 contracts and a Z-score of -1.76. The -11.4% crowding ratio reflects meaningful net short exposure. Ethanol reached 94th percentile net long (85th percentile 10-year), with a crowding ratio of 18.9% of OI. Remaining 3 market(s) near median: Gasoline RBOB (87th pct), Heating Oil (66th pct), Crude Oil WTI (68th pct).
Grains: Soybean Oil reached 99th percentile net long positioning (93rd percentile 10-year), with net longs at 120,097 contracts and a Z-score of +2.25. Soybean Meal registered 98th percentile (81st percentile 10-year), net longs 102,538. Wheat (HRW) reached 99th percentile (56th percentile 10-year), marking an extreme within the recent 2-year sample but mid-range in longer context. Cotton sits at 94th percentile (37th percentile 10-year). Cocoa reached 3rd percentile net short positioning (7th percentile 10-year), with net shorts at -17,859 and a Z-score of -2.18. Remaining 11 market(s) near median: Coffee C (6th pct), Corn (91st pct), Soybeans (94th pct), Sugar #11 (6th pct), Wheat (SRW) (83rd pct), Live Cattle (33rd pct), Lean Hogs (55th pct), Feeder Cattle (47th pct).
Bonds: 2Y Treasury reached 1st percentile net short positioning (both 2-year and 10-year), with net shorts at -1,482,667 contracts and a crowding ratio of -31.3% of OI—the most concentrated short exposure in the dataset. 10Y Treasury sits at 80th percentile (27th percentile 10-year), with net shorts at -597,878. 30Y Treasury reached 89th percentile net long (81st percentile 10-year), with net longs at 8,764. The curve divergence is notable: extreme net shorts at the front end, near-neutral positioning at the long end. Remaining 2 market(s) near median: 5Y Treasury (63rd pct).
Crypto: Bitcoin reached 99th percentile net long positioning (both 2-year and 10-year), with net longs at 1,773 contracts and a crowding ratio of 7.4% of OI. The Z-score of +2.11 places this near the upper boundary observed in the 104-week sample. Remaining 1 market(s) near median: Micro Ethereum (31st pct).
Index: Dow Jones registered the alignment signal this week: both large speculators and commercials are positioned net short, leaving small speculators holding the entire net long position. Large spec net shorts stand at -954 contracts (-1% of OI), while commercial net shorts are -3,213 (-3.3% of OI). Because futures markets are zero-sum, this means retail-held net longs represent the full counterparty to both institutional groups. The COT percentile sits at 27th—not extreme, but the alignment structure is notable. Remaining 4 market(s) near median: S&P 500 (35th pct), Russell 2000 (37th pct), Nasdaq 100 (58th pct), VIX (49th pct).
Alignment Signal — Small Speculators Hold the Counterparty
One market displayed the alignment configuration this week: Dow Jones. Both large speculators and commercials are positioned net short, leaving small speculators (the retail public) holding the entire net long position. Large spec net shorts stand at -954 contracts (-1% of OI), while commercial net shorts are -3,213 (-3.3% of OI). Because futures markets are zero-sum, when two groups align on one side, the third group must hold 100% of the offsetting position.
The COT percentile rank for Dow Jones is 27th—mid-range, not extreme—so this alignment occurs without a crowded positioning backdrop. Historically, similar configurations have sometimes coincided with periods of elevated positioning volatility for the retail-held side, though this is a structural observation rather than a directional indicator. This is a positioning concentration flag, not a standalone directional signal.
📍 Key Questions for Next Week
- Will Australian Dollar positioning extend beyond Z-score +3.0, or does the 99th percentile mark a ceiling within this 104-week sample?
- Will 2Y Treasury net shorts deepen further below the 1st percentile, or does the -31.3% crowding ratio represent peak speculative selling?
- Do Gold and Silver stabilise at current 1st percentile levels, or does the washout extend into deeper negative Z-score territory?
This analysis is for educational purposes only and does not constitute financial advice.
Check back next Friday for the latest COT report analysis covering the week ending March 24, 2026.
Explore More: Interactive Dashboard | Complete Methodology | Download Data | Previous Analysis