What Are Percentile Rankings in COT Data?
Feb 11, 2026
Percentile rankings are how we convert raw contract numbers into a meaningful, comparable score. Without them, knowing that non-commercial traders hold 245,000 net long Gold contracts tells you very little. With a percentile rank, that same number becomes: this is larger than 99% of all recorded weeks.
This page explains the methodology behind percentile rankings, how to interpret them, and their limitations.
What a Percentile Rank Tells You
A percentile rank answers one question: Where does this week's position sit relative to the full historical record?
- A 99th percentile reading means the current position is larger than 99 out of 100 historical weeks.
- A 1st percentile reading means it is smaller than 99 out of 100 historical weeks.
- A 50th percentile reading means it sits exactly in the middle of the range.
The number itself is not a signal. It is a description of how unusual the positioning is right now compared to what has been normal historically.
How We Calculate It
The calculation is straightforward. For each market and each report week:
- Collect all non-commercial net positions from the historical database (up to 104 weeks).
- Sort those values from lowest to highest.
- Count how many historical values fall at or below the current value.
- Divide that count by the total number of historical weeks, then multiply by 100.
If 99 out of 100 historical weeks had a lower net position than today, the percentile rank is 99.
We apply a half-unit correction (subtracting 0.5 before dividing) to avoid returning exactly 0 or 100 for non-extreme values. Ranks are then capped between 1 and 99.
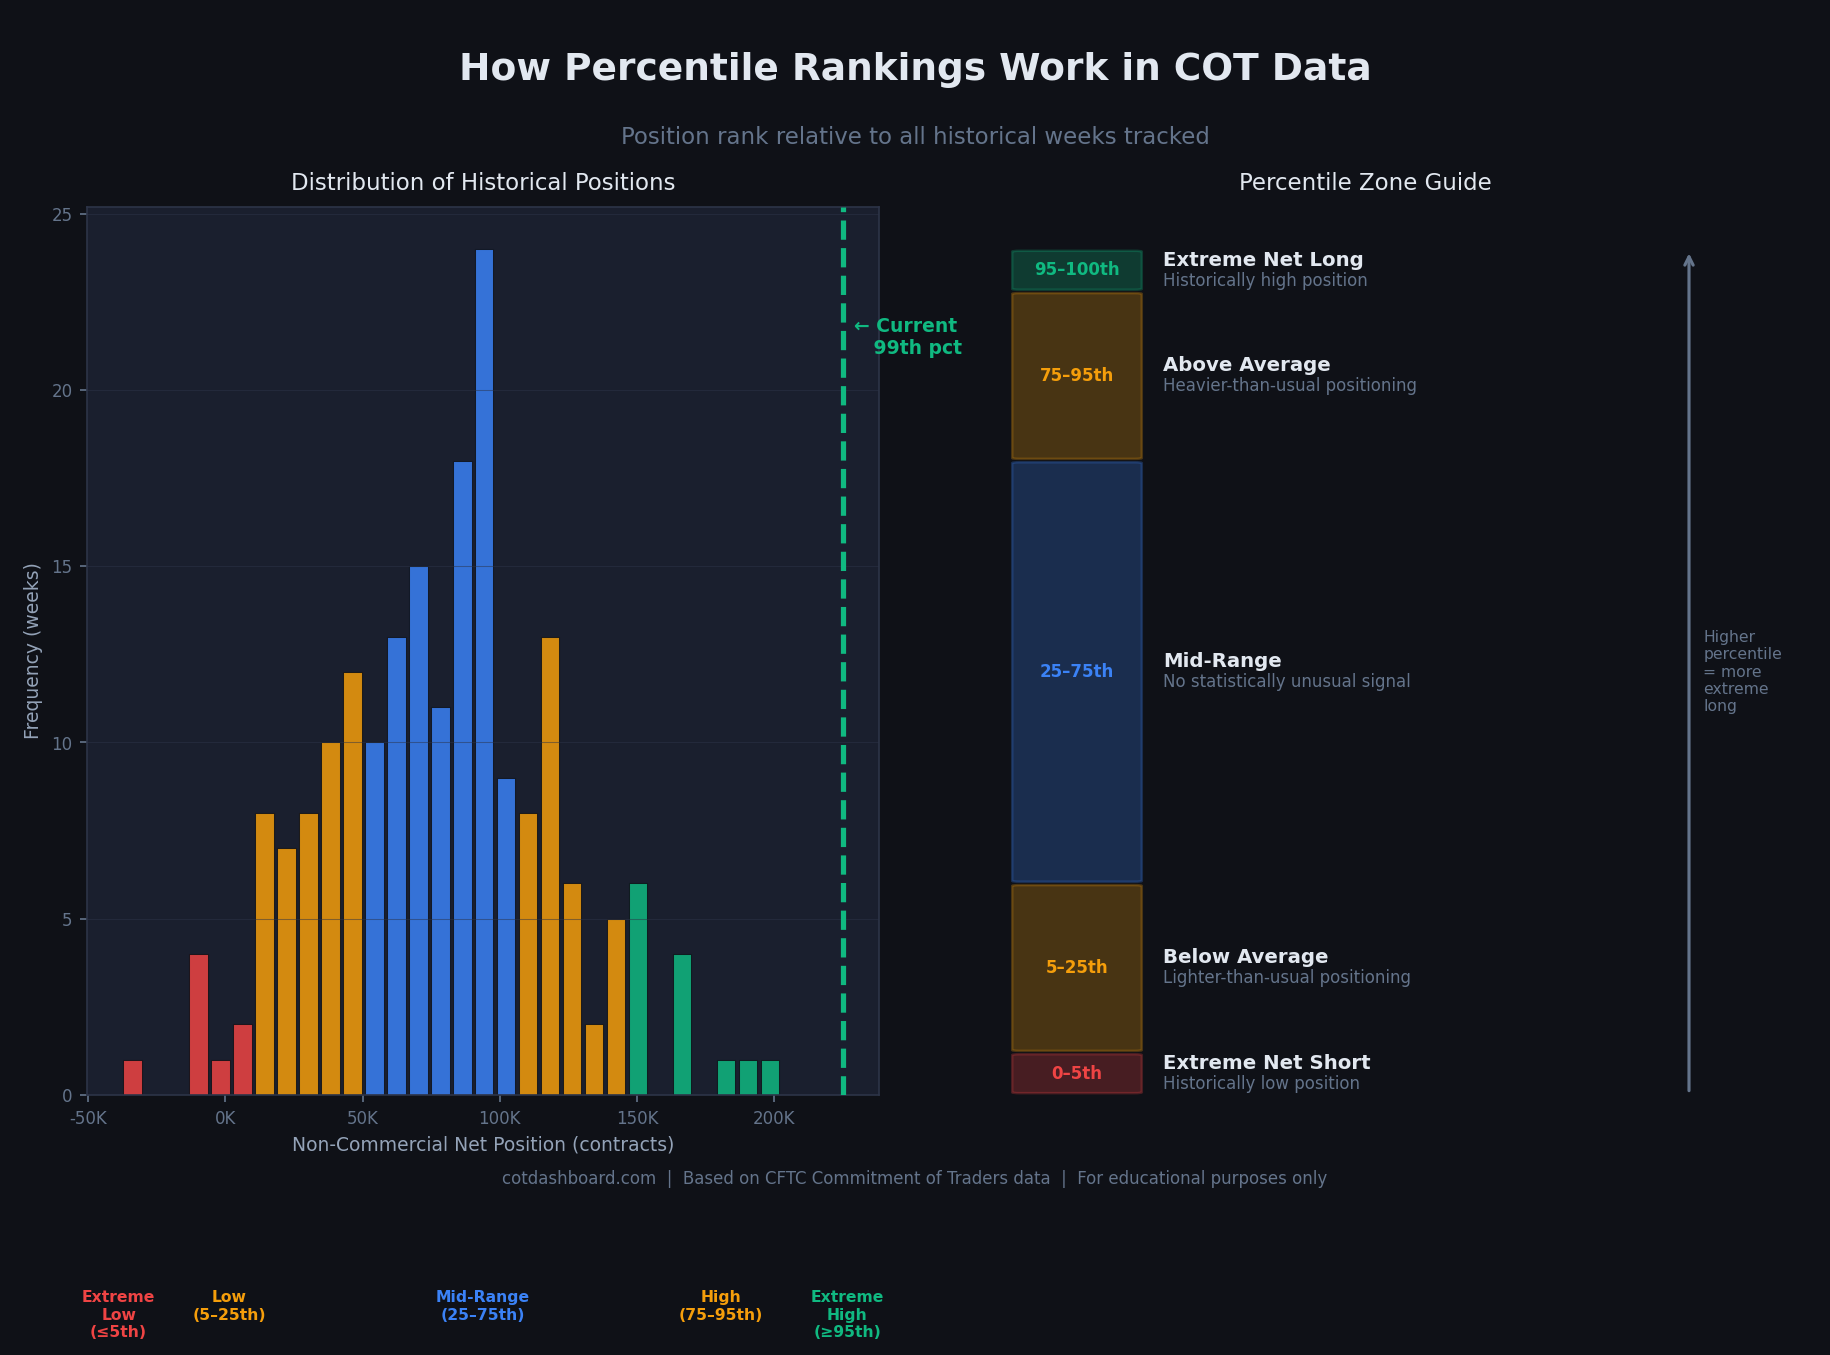
Distribution of historical net positions and the corresponding percentile zones. The current position (dashed green line) falls in the extreme-high zone.
The Five Zones
For practical reading, we group percentile ranks into five zones:
| Zone | Percentile Range | What It Means |
|---|---|---|
| Extreme Low | 0–5th | Position near the lowest on historical record |
| Below Average | 5–25th | Lighter positioning than usual |
| Mid-Range | 25–75th | No statistically unusual positioning |
| Above Average | 75–95th | Heavier positioning than usual |
| Extreme High | 95–100th | Position near the highest on historical record |
Mid-range readings (25–75th) carry no particular analytical weight. Extreme readings (≤5th or ≥95th) indicate that positioning has become stretched relative to history.
How Many Weeks of Data Do We Need?
Percentile rankings become more meaningful as the historical database grows. Here is how confidence scales with data availability:
Under 13 weeks: Rankings are descriptive only. We report directional bands (e.g., "upper quartile") rather than precise percentiles, because the sample is too small to be reliable.
13–52 weeks: Rankings are moderately reliable. Useful for identifying early trends, but extreme readings can be artefacts of a limited window.
52+ weeks (1 year): Rankings become statistically robust. At this point, a 95th percentile reading genuinely reflects an unusual position in the context of a full market cycle.
104 weeks (2 years): Our target baseline. Most markets go through at least one complete positioning cycle within two years, so the full range is reasonably well represented.
Reading the Percentile Table
The dashboard and weekly blog posts display a summary table. Here is how to read a row:
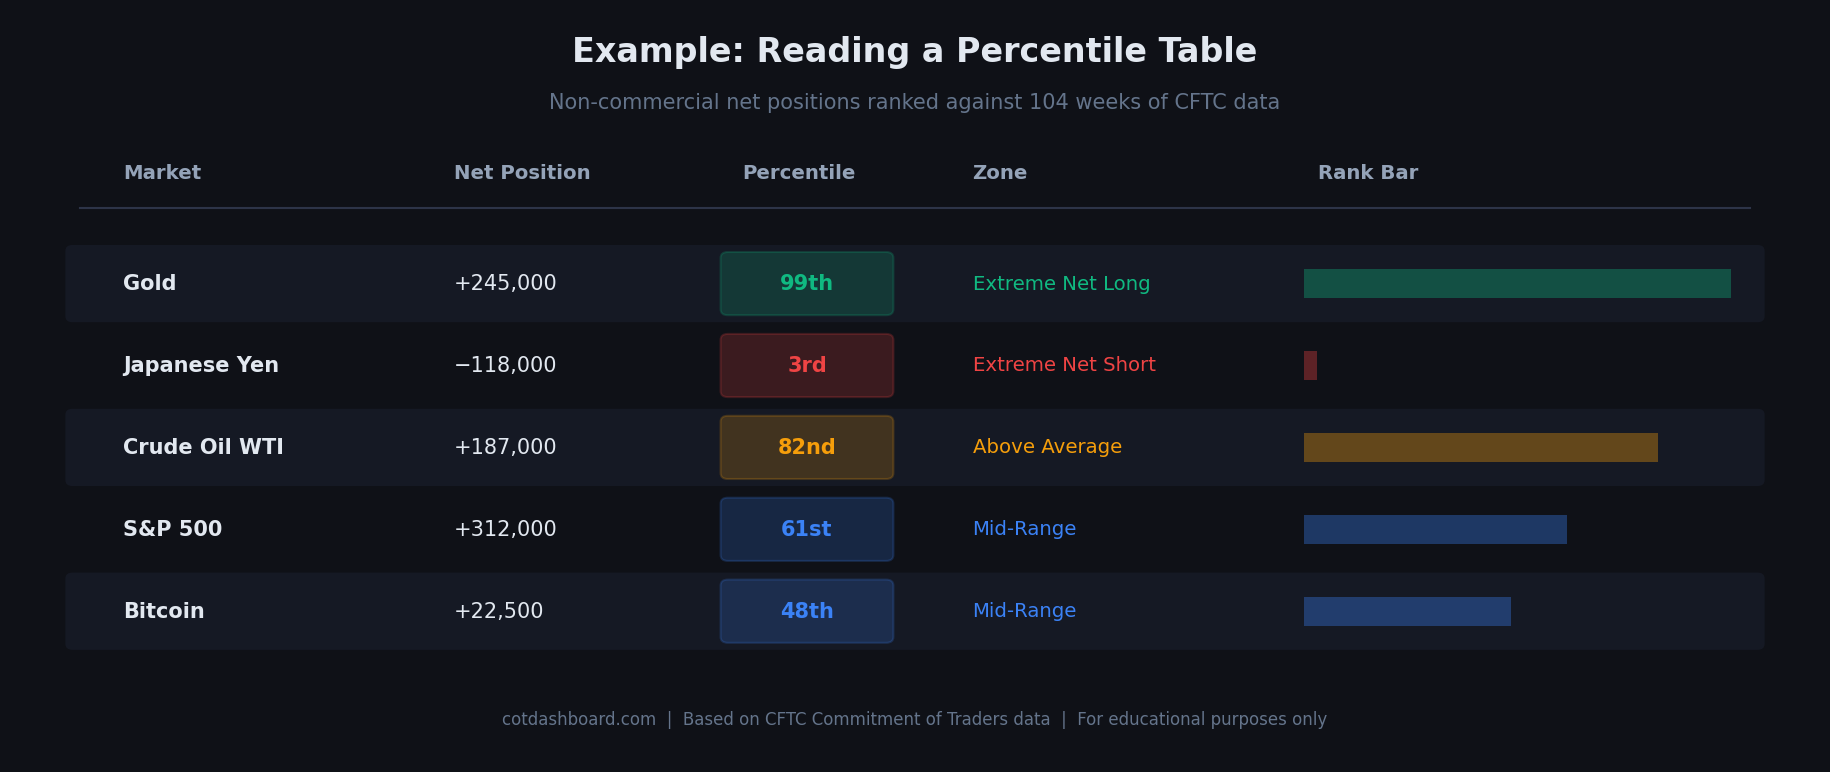
Each row shows the net position, percentile rank, zone colour, and a proportional bar for quick visual comparison.
The rank bar at the right of each row is proportional: a 99th percentile reading nearly fills the bar; a 10th percentile reading is a thin strip on the left.
What Percentile Rankings Do Not Tell You
Percentile rankings describe positioning. They do not:
- Predict price direction. An extreme position can persist for weeks or reverse the following day.
- Indicate a specific reversal point. Markets can reach a 95th percentile and then extend further to 98th or 99th before any change occurs.
- Account for structural shifts. If overall market participation grows significantly (e.g., a new instrument gaining adoption), the historical range may no longer be representative.
- Replace fundamental analysis. A stretched short position in Yen may reflect a sustained macro theme rather than a mean-reversion opportunity.
Treat them as a lens on relative positioning, not a trading signal.
Z-Scores: A Complementary Measure
Alongside percentile ranks, we also calculate Z-scores for markets with 52+ weeks of history.
A Z-score measures how many standard deviations the current position is from the historical mean:
- Z-score of 0 = exactly at the historical average
- Z-score of +2 = two standard deviations above average (unusual)
- Z-score of −2 = two standard deviations below average (unusual)
Z-scores and percentile ranks tend to agree. When they diverge — for example, a 96th percentile rank with a Z-score of only 1.4 — it usually means the distribution is skewed. The actual position is near a historical extreme, but not dramatically far from the mean in absolute terms.
A Note on Changing Baselines
Our percentile rankings are calculated against the weeks stored in the database, which currently spans up to 104 weeks. As new data is added each week, older weeks drop off and the baseline shifts.
This means a reading of "72nd percentile" this week might become "68th percentile" next week, even if the position itself did not change — simply because the historical window updated.
This is expected behaviour. Percentile ranks are always relative to the available history.
Related Pages
- How to Read COT Data — interpreting the raw report columns
- Full Methodology — complete technical documentation of our data pipeline
- COT Glossary — definitions for non-commercial, open interest, and other terms
- Interactive Dashboard — view current percentile rankings for all 41 markets