Understanding COT Data for Crypto Markets
Feb 13, 2026
Crypto futures COT data is the newest and smallest category in our dashboard. Bitcoin CME futures were first listed in December 2017; Micro Ethereum launched in December 2021. This means our historical database for crypto is shorter than for traditional markets, which affects how percentile rankings should be interpreted.
That shorter history aside, crypto COT data offers a genuinely useful signal: it shows how regulated institutional participants are positioned in Bitcoin and Ethereum through exchange-listed futures — a segment of the market that is otherwise difficult to observe.
The Two Crypto Markets We Track
| Symbol | Market | CFTC Code | Contract Size | Exchange |
|---|---|---|---|---|
| BTC | Bitcoin | 133741 | 5 BTC per contract | CME |
| ETH | Micro Ethereum | 146022 | 0.1 ETH per contract | CME |
The size difference between these two contracts is dramatic. One Bitcoin contract represents 5 BTC — at $80,000 per BTC, that is $400,000 notional per contract. One Micro Ethereum contract represents 0.1 ETH — at $3,000 per ETH, that is $300 notional per contract.
Because Micro ETH contracts are so small, the contract count in the COT report will typically be much higher than for Bitcoin, but the notional exposure is much lower. Always keep contract sizes in mind when comparing the two.
What CME Crypto Futures COT Data Represents
CME-listed crypto futures are regulated by the CFTC and traded by institutional participants: hedge funds, asset managers, proprietary trading firms, and market makers. This is a specific and important subset of the broader crypto market.
What is included:
- Institutional long and short positions in CME-listed Bitcoin and Micro Ethereum futures
- Both outright directional bets and hedges of spot crypto holdings
What is not included:
- Spot Bitcoin or Ethereum purchases (holding actual coins)
- Perpetual futures and other products on offshore exchanges (Binance, Bybit, OKX, etc.)
- Options positioning (CFTC reports futures contracts only in the Legacy format we use)
- Retail crypto holdings or positions
This means the COT data captures a regulated slice of institutional positioning — not the full picture of market sentiment. The offshore perpetuals market is many times larger than CME futures in terms of daily volume. CME data is a useful institutional signal, not a complete view of crypto positioning.
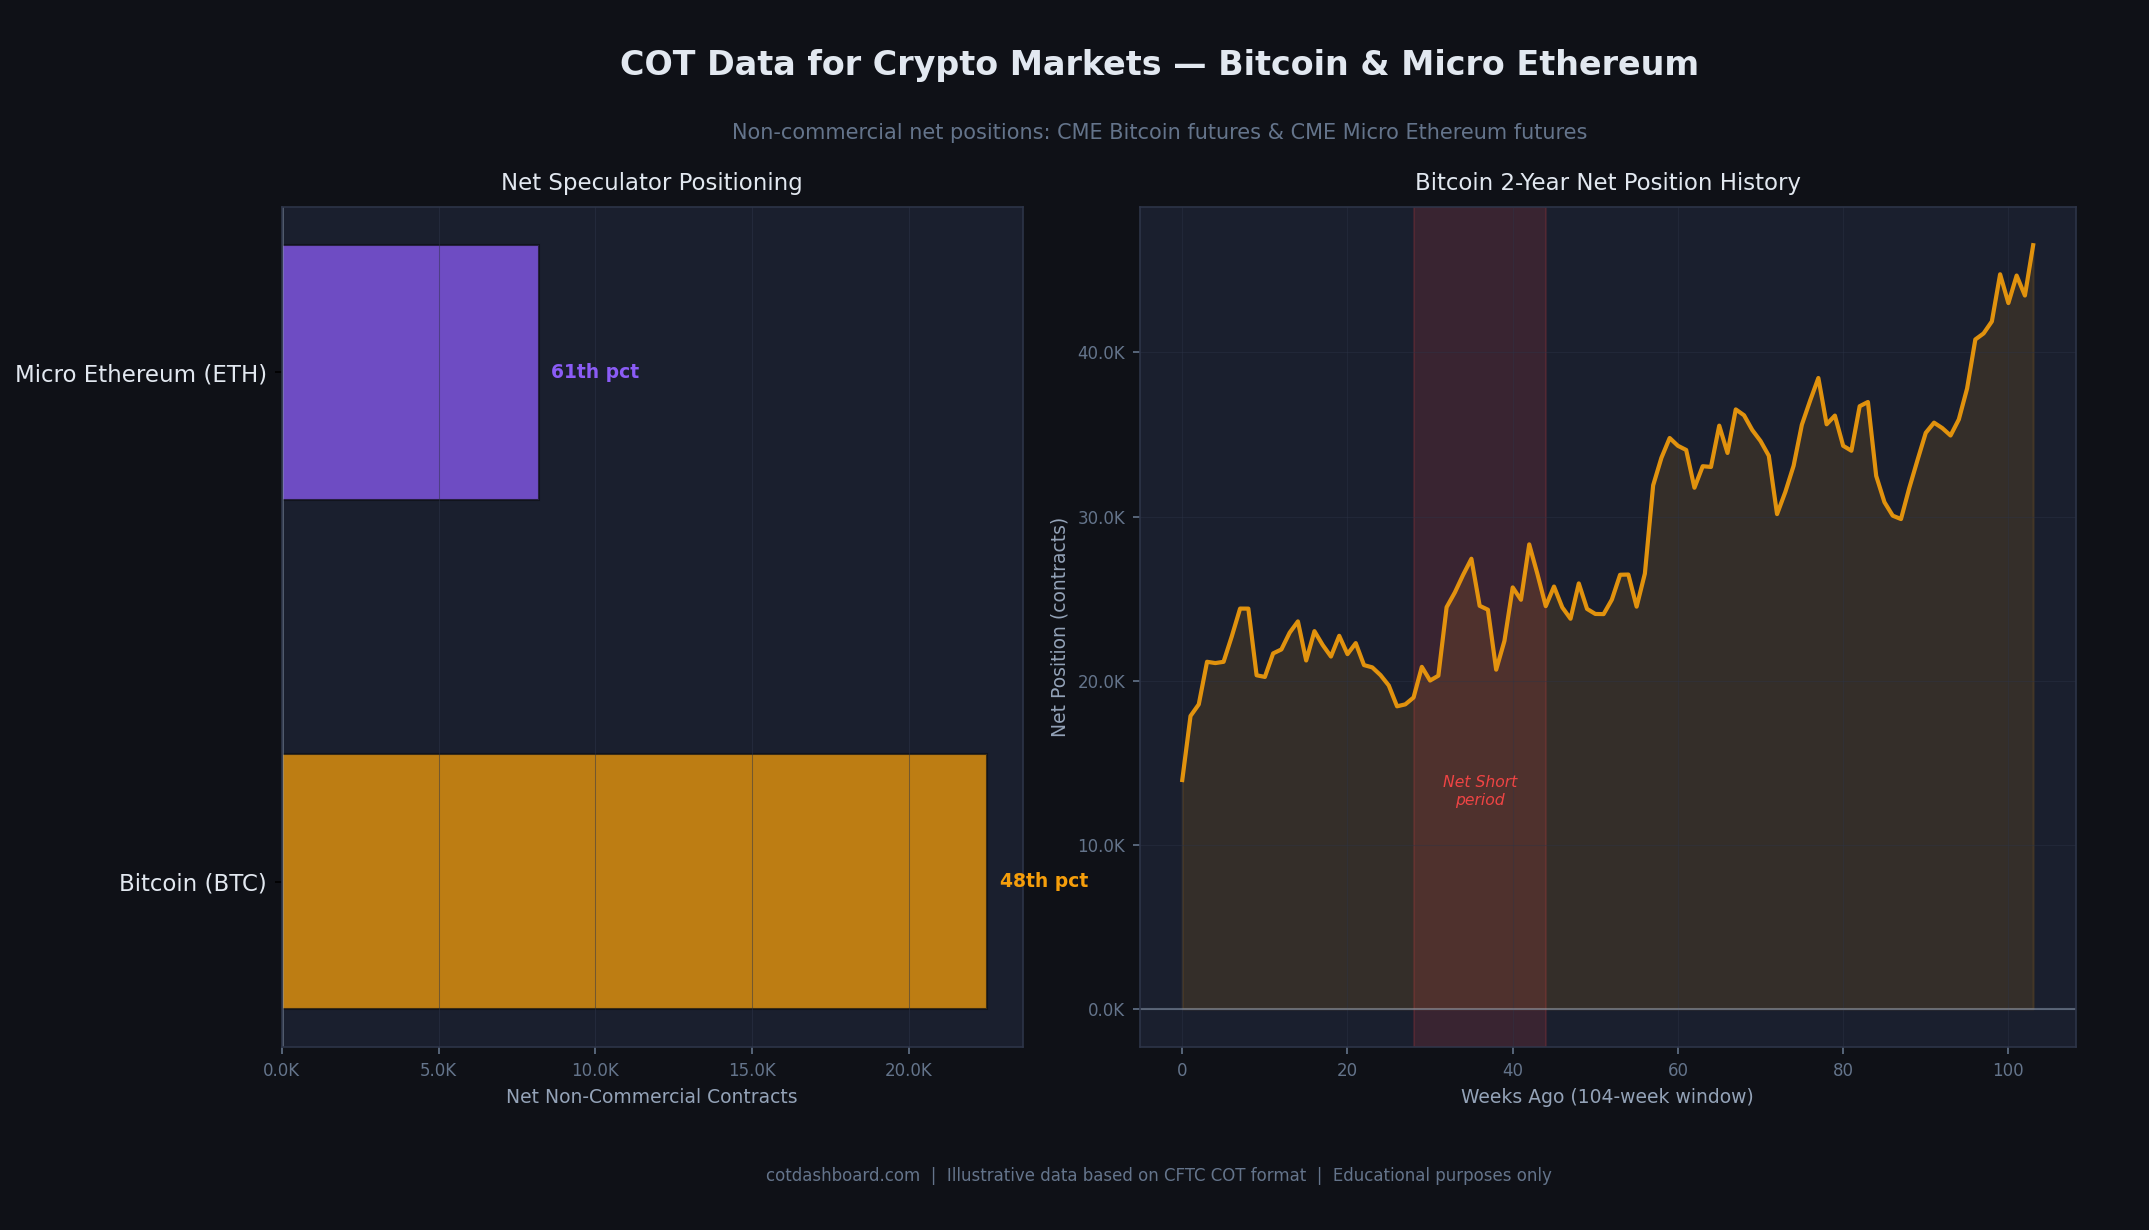
Left: current net positions with percentile ranks. Right: Bitcoin 104-week net position history. The red shaded region illustrates an example period where speculative positioning turned net short — which has occurred during sustained crypto bear markets.
The Significance of Net Short Crypto Positioning
Unlike Gold or Crude Oil, crypto futures can and do go net short for sustained periods. During the 2022 crypto bear market, non-commercial positioning in Bitcoin futures was net short for an extended stretch — meaning more speculative contracts were held short than long.
This is worth noting because in most commodity markets (particularly metals), a sustained net short by non-commercial traders is relatively rare and signals an unusual bearish conviction. In crypto, it can reflect a bear market consensus that lasts months.
Conversely, rapid moves from net short to net long positioning in Bitcoin have historically coincided with significant price recoveries. The COT data captured the early stages of these shifts. This is an observation, not a predictive rule.
How Crypto COT Positioning Correlates with Other Markets
Bitcoin positioning shows notable correlations with two other categories in the dataset:
Equity index positioning (Nasdaq 100, S&P 500). Bitcoin has historically behaved as a risk asset, particularly over 2021–2024. When equity positioning is net long and expanding, Bitcoin positioning tends to follow. During risk-off events, both tend to see long positioning unwind.
Gold positioning. The correlation with Gold is weaker but present during specific macro regimes — particularly periods of dollar weakness and inflation concern. During these episodes, both Gold and Bitcoin positioning can build simultaneously, reflecting broad anti-fiat sentiment.
Neither correlation is stable enough to use as a reliable cross-market indicator, but divergences between crypto and equity positioning can be informative.
Historical Data Limitations for Crypto
The shorter history of crypto futures is the most important limitation for this category.
Bitcoin futures launched in December 2017. Our 104-week maximum window means the earliest data in our database dates back roughly two years — a period that may or may not include a full bull-bear cycle depending on when you are reading this.
Micro Ethereum futures launched in December 2021, making the ETH dataset even shorter. With fewer than 104 weeks of available data, Ethereum percentile rankings are calculated against a smaller sample, which means they should be treated as indicative rather than historically robust.
We flag the number of weeks used in each percentile calculation in the weekly blog posts and dashboard data. For Ethereum in particular, watch for when this number reaches 52 weeks (one year) as a minimum threshold for treating percentile ranks as meaningful.
The Commercial Side in Crypto Futures
In crypto futures, commercial traders include:
- Bitcoin mining companies hedging future BTC production revenue
- Crypto-native funds with spot holdings hedging downside risk
- Market makers managing inventory
Commercial short positioning in Bitcoin reflects miners and spot holders locking in future sale prices — similar to how gold miners or oil producers use futures to hedge. This is a sign of market maturation. In 2018, there were almost no genuine commercial hedgers in Bitcoin futures.
The growth of the commercial category relative to speculative positioning is itself a measure of institutional adoption of crypto as an asset class.
Limitations Specific to Crypto Markets
CME futures are a small share of global crypto volume. Daily CME Bitcoin futures volume is typically a fraction of the volume on offshore perpetuals exchanges. The COT data represents a regulated institutional segment, not a representative sample of all crypto trading.
Contract size changes have occurred. CME introduced Micro Bitcoin futures (1/10 of a standard Bitcoin contract) in 2021. The legacy COT data we use tracks standard BTC futures (5 BTC/contract), not micro contracts. This means open interest and participation levels have a structural break in the data around 2021 when smaller participants shifted to micro contracts.
Regulatory environment can affect participation. Unlike established commodity markets, crypto futures participation is sensitive to regulatory developments. New rules or enforcement actions can abruptly shift who participates in these markets, affecting what the COT data represents.
Related Pages
- What Is the COT Report? — foundation reading
- How to Read COT Data — column-by-column walkthrough
- What Are Percentile Rankings? — how positions are ranked vs history, and why data window size matters
- Commercial vs Non-Commercial Traders — understanding the speculator vs hedger split in crypto
- Do Extreme COT Positions Predict Reversals? — especially relevant given crypto's volatility
- COT Data Limitations — what the data cannot tell you, critical for crypto's short history
- Understanding COT Data for FX Markets — another category where macro sentiment is a key driver
- COT Glossary — key terms defined
- Interactive Dashboard — current crypto positioning data